Streudiagramm
-
Beispielsätze:
- Aus dem Muster (Punktwolke) des entstehenden Streudiagramms kann erkannt werden, in welcher Abhängigkeit die beiden Merkmale zueinander stehen.

scatter diagram
Description:
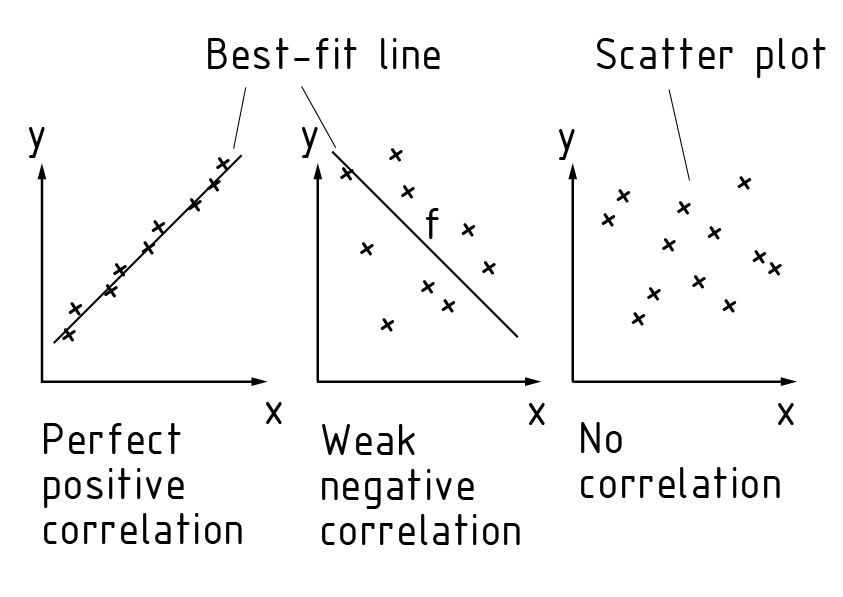
A scatter diagram is used to display the correlation between two variables as a value pair (x/y). To this end, the variables are entered in a Cartesian (rectangular) coordinate system. The pattern (scatter plot) of the resultant scatter diagram shows the dependence between the two variables. A regression analysis quantifies the Strength of the relationship between the two variables. The method of least squares is used to lay a best-Fit line f through the scatter plot. The slope of the line determines the direction of the correlation If there is complete correlation between two variables $(\left| r \right| = 1)$, all values in the two-dimensional coordinate system lie on a line. In the case of perfect positive correlation (r = +1), the line slopes up. In the case of perfect negative correlation (r = -1), the line slopes down. The scatter diagram is one of the "Seven Tools" of Quality management.
-
Example sentences:
- The pattern (scatter plot) of the resultant scatter diagram shows the dependence between the two variables.
- The scatter diagram is one of the "Seven Tools" of quality management.
- A scatter diagram is used to display the correlation between two variables as a value pair (x/y).
- The pattern (scatter plot) of the resultant scatter diagram shows the dependence between the two variables.
scatter plot
Description:
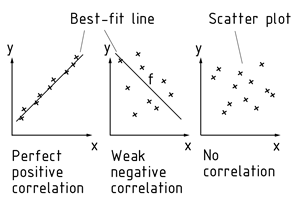
The method of least squares is used to lay a best-fit line f through the scatter plot. The pattern (scatter plot) of the resultant scatter diagram shows the dependence between the two variables.
-
Example sentences:
- The method of least squares is used to lay a best-fit line f through the scatter plot.
- The pattern (scatter plot) of the resultant scatter diagram shows the dependence between the two variables.
- The pattern (scatter plot) of the resultant scatter diagram shows the dependence between the two variables.

diagrama aleatorio

散点图
Description:
散点图显示作为数值对 (x / y) 的两个变量之间的相关性。为此,变量可表示在笛卡尔(直角)坐标系统中。所得散点图的图案(散点图)显示出了两个变量之间的依存关系。 回归分析量化两个变量之间的关系相关程度。最小平方法用于绘制散点图的最佳拟合线f。直线的斜率确定相关性的方向;无量钢的相关系数值 ${r_{xy}}$ 描述了两个变量之间的相关程度。 如果有两个变量之间完全相关 $(\left| r \right| = 1)$ ,那么平面坐标系统中的所有变量值在一条直线上。在完全正相关 (r = + 1) 的情况下,直线向上倾斜。在完全负相关 (r = -1) 的情况下,直线向下倾斜。 散点图是质量管理的“ ”之一。 相关图 近义词 散点图